
This project involved using Python to interact with the CoinMarketCap API in order to extract real time data to a dataframe. Using various python packages the script allows you to collect data with timestamps and append to a dataframe. The script also makes use of functions automating data requests periodically. Finally, matplotlib and seaborn were utilised to create visualisations of the data collated. A fun project that allowed me to dig deeper into the world of data in Cryptocurrency.

This project required using Python and several packages, including CSV, pandas, datetime, requests and smtplib. This project allowed me to explore web scraping and interacting with website HTML in order to extract specific data. Using Python, I was able to automate the price extraction process regularly to check for price changes and integrate the script with email to act as a price alert.

This SQL portfolio project analyzes UFC fight data. It calculates and compares win percentages, age differences, weight class outcomes, and fighter stances. The project examines correlations between factors like height, weight, age, and stance, shedding light on winning tendencies. The queries provide insights into fighter strategies and preferences, showcasing statistical analysis skills.

Experience the creation process behind my Tableau dashboard for Arsenal FC. From intricate data gathering and cleansing to advanced visual design, I meticulously crafted the map for average points, correlated attendance with performance, utilized historical player stats for top goal contributors, employed time-series analysis for Elneny's passes, and showcased evolving home vs. away trends.
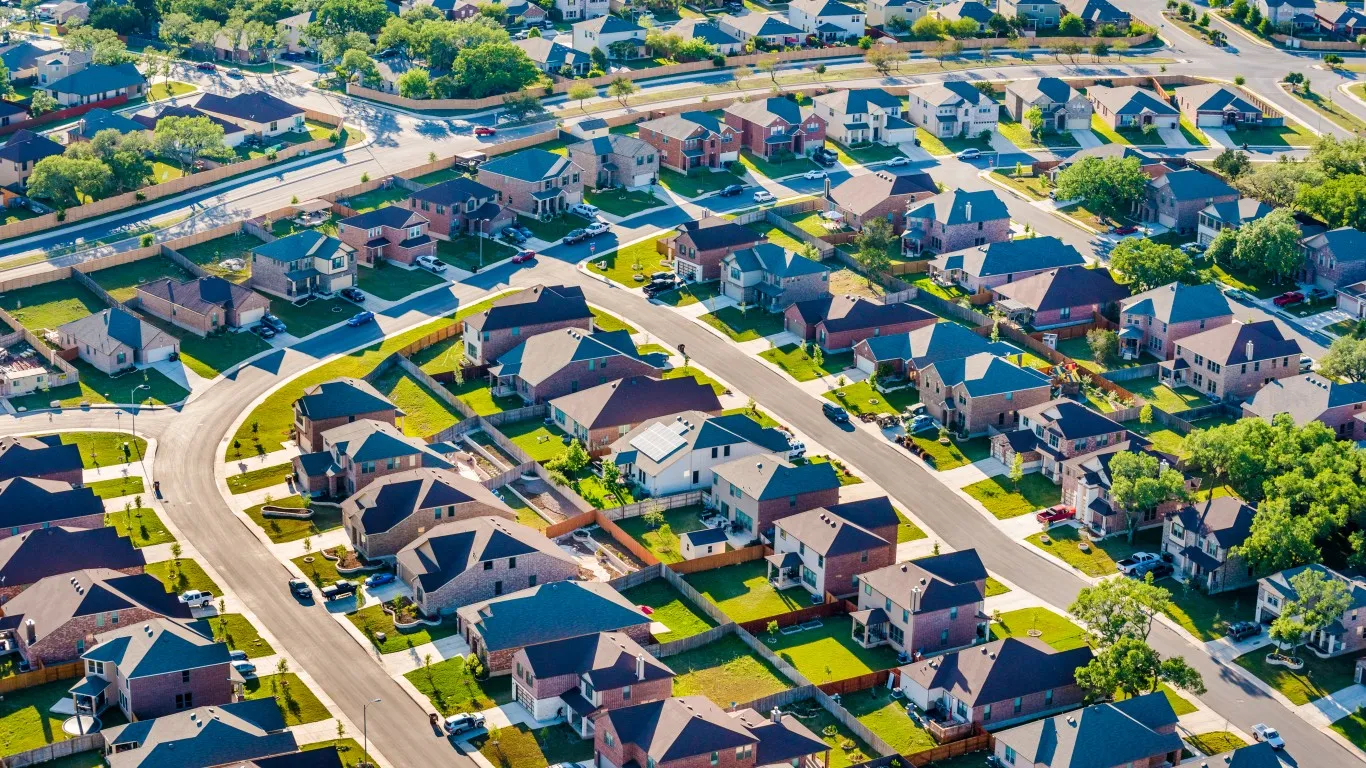
In this SQL data cleaning project, I meticulously process Nashville Housing data. I handle missing values, remove duplicates, standardize formats, and ensure data integrity. The result is a refined dataset ready for meaningful analysis, demonstrating my data preparation proficiency.

Unveil insights in my Power BI dashboard fueled by 600+ data professionals survey responses. Analyze trends, preferences, and challenges, showcasing my data aggregation, visualization, and analytical prowess. A comprehensive snapshot of the data professional landscape.

This project took raw bike sales data and culminated with an Excel dashboard. Utilising pivot tables and filters to illuminate sales trends, product performance, and customer preferences. A brief insight into how data can inform business decisions.